 | |
This page is under development.... The process approach 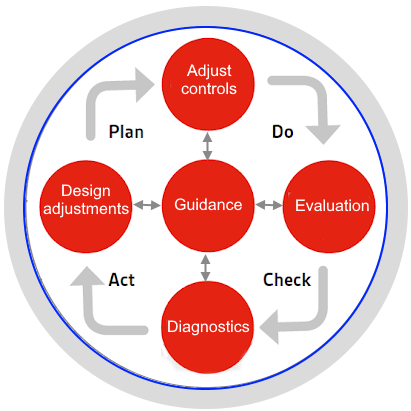 Anyone with experience of former agricultural extension systems will have a basic understanding of the so-called process approach which constitutes part of standards or recommendations for good practice supported by OSI, BSI and the OQSI. It consists of a reiterative approach to improving the performance of any process by establishing the basic design of the process, setting it up and operating it. As a result of monitoring its performance some diagnostics of the observed performance can lead to improvements in design or in techniques applied to the basic technology. At the centre of this cycle is a series of guidance decisions as shown in the diagram on the right. Anyone with experience of former agricultural extension systems will have a basic understanding of the so-called process approach which constitutes part of standards or recommendations for good practice supported by OSI, BSI and the OQSI. It consists of a reiterative approach to improving the performance of any process by establishing the basic design of the process, setting it up and operating it. As a result of monitoring its performance some diagnostics of the observed performance can lead to improvements in design or in techniques applied to the basic technology. At the centre of this cycle is a series of guidance decisions as shown in the diagram on the right.An important aspect of this approach is the documentation of progress so that there is a record of the expansion in the "known universe" of the factors influencing the process concerned. In terms of project design this is referred to as a Project Memory which in reality is a Process Memory. Innovation Innovation is the process/event where something is accomplished in a different way for the first time in a specific location. The locational-state dimensions of this relate to the fact that what is innovation in one location can be the result of a process which is used in another location is used for the first time in a new location. This type of innovation or technology transfer is a common basis for the dissemination of innovations over geographic space and time. 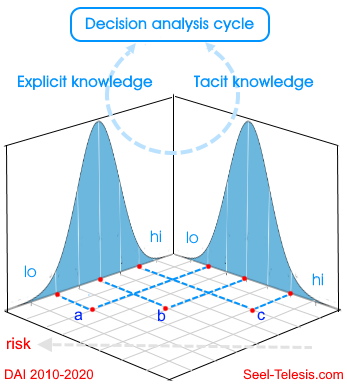 However, the process approach, by its incremental nature of improvements in performance represents a constant flow of innovation with each innovation being an incremental improvement in what was done before. The knowledge universe The agency through which the process approach is managed and operated through a process of decision analysis that makes use of two types of knowledge. These are explicit and tacit knowledge. The diagram on the left shows a 3D representation of the interpay of explicit and tacit knowledge. Explicit knowledge is the information, data and symbology used to analyse and describe determinant relationships of cause and effect used to design a process as well as observe, monitor and record performance. Explicit knowledge is the knowledge "about" the process. Tacit knowledge is the acquisition and application of practical capabilities to operate a process as well as bring about change in the operation of the process. It is an intimate understanding and ability to control both in intellectual and pohysical terms the performance of the current process design that has been implemented. Performance of a specific technological configuration can be different levels of operational performance according to the tacit knowledge of the operators. More experience operators will make use of the technology more effectively that people with less experience. The combination of abilities to make effective use of explicit knowledge on current performance with different techniques applied by the human operators can result in significantly different levels of performance. In terms of risk associated with change in design, the more competence there is in observation, recording and analysing perfomance data and the more competence there is in terms of tacit knowledge, changes will usually incur less risk of failure that those situations wehre there is less capability in terms of exiscit and tacit knowledge. Thus in the diagram on the left, point "a" represents a situation os low explicit and tacit capabilties and high risk. 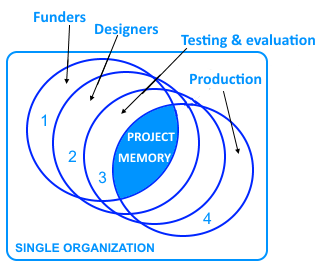 On each wall to this 3D cube the normal distributions of explicit and tacit knowledge within populations are represented by the blue "normal" distributions. Point "a" is the likely state of affairs of inexperienced people or novices just embarking on a process of learning about their process and how to improve it. Those wiht "average" capabilities and experienc in handling explicit and tacit knowledge might be located at point "b" where the risk of false design steps is lower. In the case of competent observation and recording of performance and advance or prolonged operational experience then explicit and tacit knowledge is likely to be operating at a level that result in process innovations incurring the least risk. On each wall to this 3D cube the normal distributions of explicit and tacit knowledge within populations are represented by the blue "normal" distributions. Point "a" is the likely state of affairs of inexperienced people or novices just embarking on a process of learning about their process and how to improve it. Those wiht "average" capabilities and experienc in handling explicit and tacit knowledge might be located at point "b" where the risk of false design steps is lower. In the case of competent observation and recording of performance and advance or prolonged operational experience then explicit and tacit knowledge is likely to be operating at a level that result in process innovations incurring the least risk.
Multiple and single organization process design One of the important details of the process approach when involving several redesigns is the difference between single organization or teams and multiple organization or dispersed team collaboration. The more tight knot the process development team the more rapid is innovation largely as a result of easier communication. For example in the case of the design of a project's process the interested parties can be the people paying for the activity, the designers, those carrying out monitoring, testing and evaluation and the stakeholders who will benefit from a physical output or services provided by the process. Were the teams are small then overal reporting to all including those providing the financial support is more transparent and all remain aware of the current state of development and levels of achievement. As a result there is a common understanding of the objectives and what needs to be done to improve the effeciveness of the process in attaining those objectives. As a result there is also a common terminology and high level of communications clarity and there is a tendency for all to understand the records. In the case of dispersed teams involving different departmental personnel the coorination of ecord keeping and maintenance of a common rterminology is more difficult to maintain. As a result if any key invividual leaves the team and that persons contribution or note taking has not been preserved this can create difficulties for those taking that individual's place. As a result the overall efficiency of the system declines. Project Memory To prevent the loss of "project memory" when individuals move it is apparent that the overall organization of continuing proces evolution is the maintenance of a Project memory where all events and decisions linked to the process in question are recorded. Accumulog Accumulogs are a specific configuration of databases based on a blockchain concept which was developed a decade before the blockchain cryptocurrency version appeared. Some general information is available on the Accumulog website. Otherwise more details are restricted with all rights remianing with SEEL-Systems Engineering Economics Lab. Projections of performance and the learning curve In addition to the trade-offs between short term optimization and a more transitional medium term investment is the need to analyse more closely existing plant capacities, operational capacities and yields on the one hand and incremental constraint removal on the other. Most equipment and plant has a well-defined capacity of operation and processing operations tend to work at specific levels of capacity operation. The process of analysing the potential range of operational capacity of existing equipment can identify internal constraints on higher and more efficient production. Thus unit costs can be dramatically lowered by increasing capacity utilization and yield of saleable output. Yield can be related to learning whereas it is also related to equipment settings and maintenance (each of which have learning components). Optimization over time and the learning curve The learning curve is a phenomenon summarised by measurable reductions in the resources used (including time) in the production of an object in association with the cumulative quantity of throughput. In general terms there is for many production situations a constant reduction in resources used measured in a percentage drop in resource consumption (learning index) associated with every doubling of historic cumulative production by a team or individual. Belkaoui cites Hirschmann’s summary of the basic doctrine of the learning curve as:
Geometry of the learning curve The learning index is the percentage reduction in resources used with each historic doubling of throughput. This is also expressed as a percentage curve thus more capital intensive processes might have a 90% curve signifying 10% reductions and a more labour–intensive process might have an 80% curve indicating a 20% reduction. Examples of a 80% and a 90% curve are shown below. Belkaoui provides a convenient summary of the different approaches applied in establishing formulae upon which to calculate the shape of a learning curve and to calculate the learning index. He describes some eight (8) different formulae developed by different workers on this topic in an attempt to describe the determinants of the learning curve. These curves were developed on the basis of observed empirical data from processes and represented an evolutionary process of rationalization of formulae in an attempt to include most common eventualities. These are listed below. Learning Curve Formulae Several formulae have been devised to describe and measure the learning curve effect1 2 3. These include:
Belkaoui did not include in his study developments carried out at SEEL (Systems Engineering Economics Lab) for the good reason that this had not been published but consisted of internal notes and briefs produced in the early 1980s some of which were used in the Seel-Telesis applied R&D programme which produced regular internal reports as from 1989. SEEL’s interest and development of a specific approach to the learning curve arose as a result of a review of proposals and work undertaken by the Boston Consulting Company in the early 1980s. The objective of early work was to separate human learning components which contributed to resource economies and those effects which arise from shifts in resource usage arising from scales of production and the physical effects of, for example, the obtaining of more advantageous unit prices for inputs because of scale of inputs as well as shifts in production functions arising from changes in factor prices. SEEL's approach Research into the economic input-output relationships in companies demonstrated that performance relationships were not static but needed to reflect the interaction of the effectiveness of overall operations management of plant and equipment on the one hand and the degree of learning on the part of human resources expressed in general terms as technique. In addition, it was also understood that all current data values in any process are transitory in that depending upon their location in time-space their values will vary. Thus the use of chronological time for determining human resources works shifts, needed to take into account locational-state issues and in particular the fact that many time-based relationships are not linear nor of an even curvilinear form but of a predictable cyclical form. These observations lead to the development of a structural production functions which included full life cycle components as critical elements in the determination of corporate performance. (Hector W. McNeill, "Accounting for learning within SPFs" Soft Horizons, MSC, SEEL, 1989 and SEEL, "Advanced DScripts for online analysis of the impacts of changes in technology & technique upon the learning effect ", STScript Series, Portsmouth, 2002). The 1989 brief includes a description McNeill’s Continuous Estimator which separates out the human resources technique-related learning factors from the operational or mechanical technology-related production performance factors. Learning curve relates essentially to the reduction in the use of resources to produce a unit of output in a generic relationship which displays a constant rate of reduction according to each historic doubling in output. If unit prices of resources used remain constant there is therefore a unit cost relationship which also displays a constant rate of reduction according to each doubling in the historic output. The learning curve is essentially a measure of the subtle changes in refinement of human technique resulting from learning. However, the learning curve effects relate to a given technology which remains constant whilst technique evolves. However, in any practical situation, process throughput is also dependent upon the capacity of equipment, the capacity utilization and the yield of output. On the costs side naturally attempting to project unit cost curves into the future assumptions have to be made about the unit costs of inputs whose conditions of supply could results in variations in unit prices Sum (discrete inputs x discrete unit prices)/(C x CU x Y)(1-L)^(current/last) Learning Curve Estimate Several formulae have been devised to describe and measure the learning curve effect, these include:
This list was been compiled from: 1 Ahmed Belkaoui, "The Learning Curve - A Management Accounting Tool", pp.1-17, Quorum, 1986 2 Hector W. McNeill, "Accounting for learning within SPFs" Soft Horizons, MSC, SEEL, 1989 3 SEEL, "Advanced DScripts for online analysis of the impacts of changes in technology & technique upon the learning effect ", STScript Series, Portsmouth, 2002.
|