Agricultural production
The impact of rate of diffusion of a new technology on production and economic growth
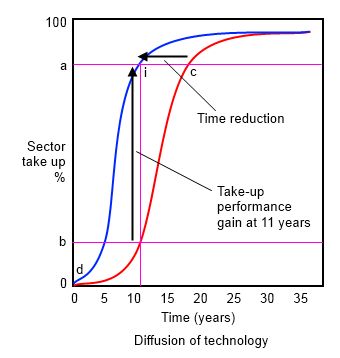
By reducing the time of take up and application of a new technology from reaching an adoption of 85% in 18 years to an adoption rate of 85% within 11 years results in a gain in take up from 70% within just 11 years instead of 18 years.
Assuming a crop area is 100,000 ha and the change in technology raises productivity from an average of 2,700 kg./ha to 5,000 kg./ha.
The gain in production will be 0.85 x 100,000 x (5,000-2,700) = 195,500 tonnes.
If the previous Gross Margin was £270/ha. and the new GM is £500/ha. the gain in profits would be £19.55 million |
In 1962 Kenneth Arrow, the American Economist, published a paper entitled "The Economic Implications of Learning by Doing" (The review of Economic Studies, Vol 29, No 3, June 1962, pp. 155-173). In this paper he explained, based on empirical evidence that the main generator of economic development is learning resulting in beneficial change as a result of practical changes in the way things are done, or, as a result of innovation.
This has been recognized over many generations and the process of agricultural development has been based on the developments of a range of new technologies and techniques which have been disseminated across geographic space largely through agricultural extension activities. Although there is a significant intellectual investment in the development of new technologies and techniques the practical impact in terms of increased production and economic growth depends upon the rate of diffusion not so much information but rather the take up and practical implementation of the new techniques.
The take up and application of new techniques varies according to the status of the farms involved. Small lower income farms require practical guidance which combined demonstrations of the techniques required, preferably under farm conditions through "farmer's field demonstrations" where farmers are provided with the opportunity to actually carry out a technique in practice. This process is of vital importance to acquaint the farmer with "what is involved" to implement a new technique and to judge for themselves the relative ease on implementation and the risks involved. This type of exposure provides farmers with more confidence to make use of the technique and initiate a process of learning by doing and the accumulation of competence in its execution (tacit knowledge).
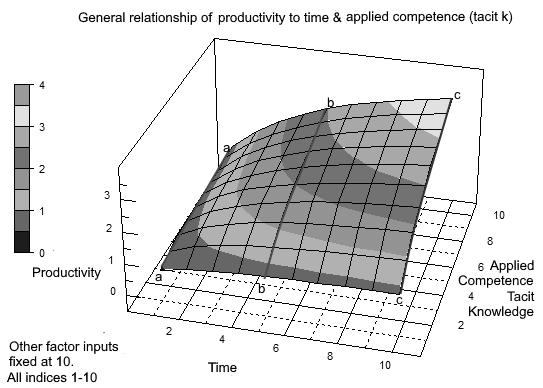
Therefore the impact of take up depends upon the process of acquisition of capability in carrying out the appropriate tasks associated with a new technology and technique. As a farmer descends the learning curve in the application of the new technology and technique the efficiency of the task execution rises involving less time, less mistakes and waste and a general decline in unit costs. As a result productivity rises following LST laws as illustrated in the MFPF model (see left).
The management of operations requires an understanding of the impact of several factors on crops yields and unit costs of output.
The quality of adviceThe foundation of good advice is an ethic based on the evaluation of reliable evidence to identify what works and does not work within a full understanding of the environment within which agricultural activities are performed. In this context the use of complete data sets upon which to base the knowledge used to provide advice is essential. An important consideration in identifying the core data set required to improve the understanding of crop yields is an understanding of locational state displacements. This refers to the separation of data collection on farms being subject to either time location or geographic location displacements or separations.
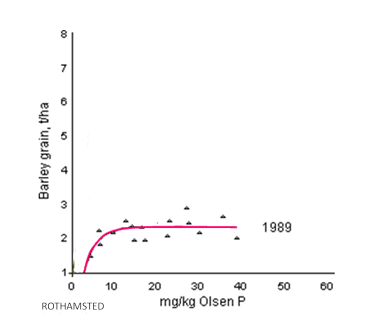
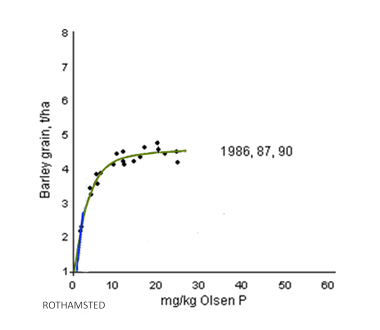
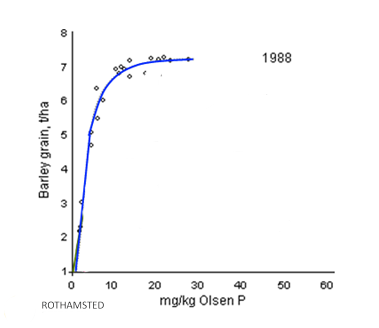
Time displacement By way of example of time displacement of data collected, the Diagrams 1, 2 and 3 show the relationship between different fertilizer applications on separate plots and the yield of barley. This experiment was repeated over a 5 years period (1986 to 1990) and the results divided into response curves that were characteristically different in each of the years concerned.
In 1989 the yield was very low attaining a maximum yield of just 2.25 tonnes/ha. In three separate years of 1986, 1987 and 1990, the yield response curves were similar attaining a maximum yield of 4.5 tonnes/ha. In 1989 the yield reached 7 tonnes/ha. The only data collected each year was the fertilizer inputs and the corresponding yields. Therefore, based on the data set it was not possible to explain the significance differences between the data sets. On the other hand the correlations between fertilizer inputs and yields were high in every year.
Diagram 4 combines these separated graphs to show the very significant yield differences obtained by the "same fertilizer treatments".
Diagram 1
 | Diagram 2
 | Diagram 3
 | Diagram 4
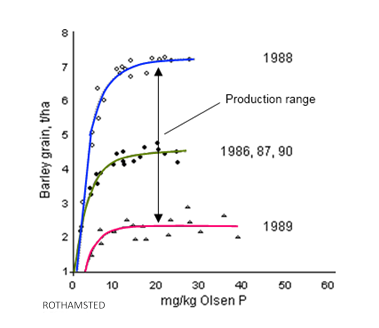 |
The reasons for the very significant differences in yield responses were the results of the impact of locational state factors in the form of the available water and ambient temperatures. In the year 1989 there was a late spring with low temperatures, inadequate rainfall during the growth period and a damp harvest period. In the years 1986, 1987 and 1990 the rainfall and temperature profiles were "normal" and the yields were close to what was considered to be average production. In 1989 the spring was early, with adequate rainfall during the growth period and a good temperature regime and dry period for harvest.
From an incomplete to a more complete data setIt is therefore evident that in order to be able to explain with more precision the variations in yield, the rainfall and temperature regimes should have also been collected as critical determinants and this would have produced a more complete data set to enable a more precise explanation of the reasons for the significant yield variations.
Relevant locational state relationshipsMention was made in this example of temperature regimes and rainfall regimes. These are explored further to trace the specific nature of these impacts on crop yields.
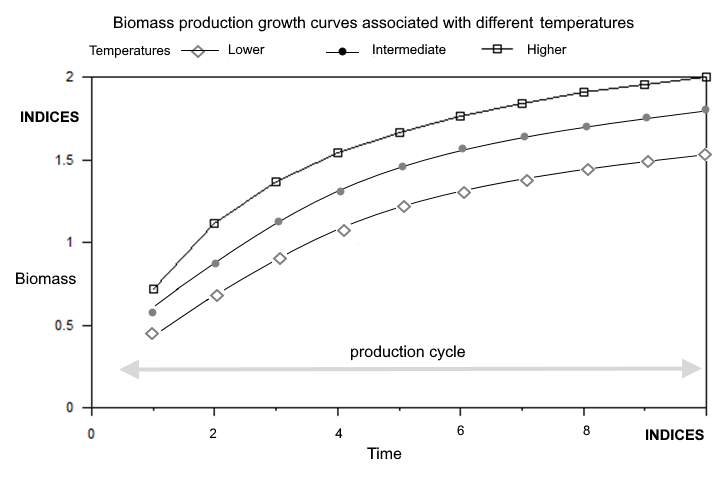
Geographic location displacementTemperature impacts Yields rise with rises in temperature linked to the fact that chemical reactions speed up with rises in temperature. For crops there is a range of temperatures over which this affects plant growth, being over the 10
oC to 35
oC range, as shown in Diagram 5 below comparing biomass production and different temperature regimes which would be within that range. Temperatures also vary with altitude by approximately 0.6
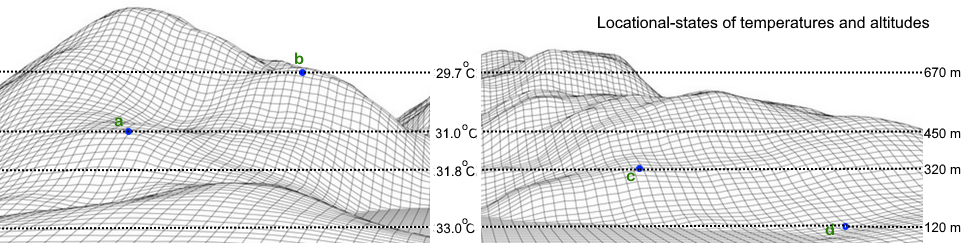
oC for each difference of 100 metres between locations. The temperature falls as the terrain altitude increases and the temperature rises by the same amount as the terrain altitude falls in altitude. This why data sets that related to production but collected from farms distributed across terrains with significant differences in altitude possess quite different values, just as in the case of year-to-year separations of data collections in the previous examples. Therefore the temperature regime biomass relationship can be represented as in the case of Diagram 6 as the effect of altitude on biomass production.
Diagram 5
 | Diagram 6
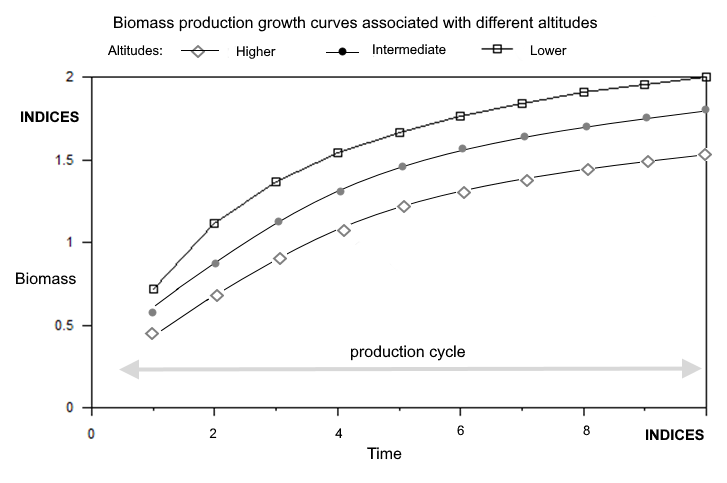 |
In the case of "rainfall regime" the locational-state relationships are also relevant. What should be noted here is that just as time location displacement affects yields, as in the case of the barley experiment, so does geographic location displacement related to altitude.
Water availability The general relationship of biomass production to availability of water is shown in Diagram 7.
Diagram 7
 |
Some soil texture standards
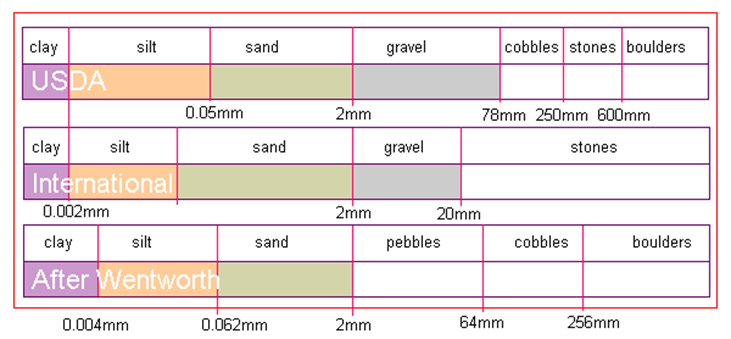
All classifications are based on variants of Wentworth's classification created in 1922 by the American geologist Chester K. Wentworth and published in The Journal of Geology: "A Scale of Grade and Class Terms for Clastic Sediments",1922. |
Water availability to plants related to soil texture
measured as the percentages of
clay, silt and sand
 |
Although in most rain fed agriculture, the source of water is rainfall, the actual availability of water to crops varies with other locational-state factors.
The availability of water to plant roots is determined by the degree of surface run off of rainwater, the degree of percolation into the soil, the texture of the soil, the evapotranspiration during the year leaving a new balance of water held known as the water deficit. Evapotranspiration is determined by the temperature regime during the year. Also the availability of the water to the plant roots is also related to the soil water holding capacity.
Soil texture is measured by the proportions of different sized particles making up the soil and classed as clay, silt and sand. There are several classifications as shown on the right.
The effect of particle size on water availability to plants is related to the capillary action of water with the specific surface of small particles having a greater attraction that larger particles. Sand, as a coarse particle size has very little capillary action and water tends to drain away under gravity. Clay being made up of very fine particles has a string capillary action and when the water content declines the capillary action creates an attraction or "tension" that exceeds the ability of plant roots to absorb water. As an intermediate particle size silt has a lower capillary tension but sufficient to prevent much of the water from draining away under gravity and thereby facilitating plant root access to the water available in the soil even under drying conditions.
| Factors influencing water deficit
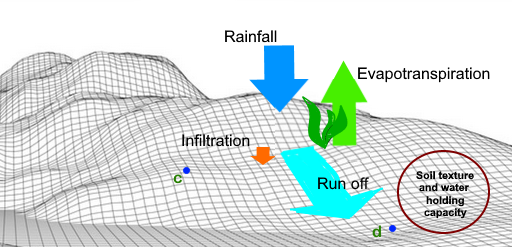 |
These general relationship influence the water holding capacity of the soil and the overall availability of water is indicated in the diagram above and on the left by the lighter blue areas in the "soil triangle".
Water deficitUseful meteorological records in calculating water deficit.
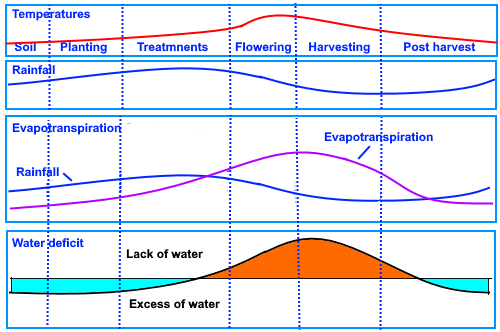 |
The actual amount of water available to plants is measured by the soil "water deficit". This can be calculated by deducting the run off, evapotranpiration and drainage of water volumes from the water delivered through rainfall measured in mm. The rates of evapotranspiration are related to leaf area indices, temperature and wind speed.
Significance of these facts to statistical analysisThe determinance of temperature as well as altitude and soil texture are all important elements in explaining the level of a crops yield. Therefore these determinants should be included where possible as a way to stratify analysis by applying a typology to farms according to their location. If these elements are not included along with meteorological records used to calculate the water deficit the precision of analysis is correspondingly lowered and it is more difficult to provide useful advice to farmers on their farm plans.
The relationship of these issues to agroecological zoningAgroecological zoning (AEZ) is a system of land classifications used to assess agrobioclimatic conditions to determine its suitability for different crops. AEZ is based on long term climatic trends whereas what has been reviewed above is the short term dynamics of agrobioclimatic variance both over time and distance. The significance of these differences are reviewed in the sections entitled
"Climate change" and
"Sustainability".