Climate change
The main emphasis in discussions of climate change refer to avoiding a rise in temperatures in excess of 1.5
oC over specific future time periods. With the rate of melting of ice caps in the two poles of the earth we have clearly passed a tipping point adding urgency to action. The impact of climate change is already disrupting agricultural production and analysis shows that rather than track average climatic temperatures, it is more important from the standpoint of sustainable production and income to pay more attention to short term meteorological cycles which follow a predictable pattern of excess and deficient temperature and water deficit. By making use if analytical tools (ATs) to plan crop production systems it is possible to lower the impact of climate change on average yields and income. The procedure required in Locational-State Genotypic Sequencing (LSGS). This method was developed by the George Boole Foundation’s Decision Analysis Initiative 2020-2030.
Why is LSGS required?
The evidence climate change in terms of rainfall intensity linked to temperature rises is particularly evident in rain fed agricultural production systems. The important message is that unless care is exercised in the selection of crops for production in any specific location there is a risk that within a decade, conditions will have changed to such an extent that the production of some selected crops is no longer feasible. This is because of the ecophysiology of the crop, linked to its genetic makeup and DNA is no longer able to adapt to seasonal variance in temperatures and water availability in terms of maintaining yields or even having any yield at all. Basically, the agroecological classification that was applicable at the initiation of project is in transition and, as a result, the agroecological conditions will have changed, impacting yields and costs within a decade.
This has significant implications for the decision analysis applied to agricultural projects in terms of the selection of production systems that combine sustainability with financial feasibility, while allowing for the adjustments that need to take place under changing bioclimatic (agroecological) conditions.
Currently methods applied in agroecological zoning are based principally on calculations based on the slow-moving changes in average annual temperature and rainfall regimes. Agroecological zoning, such as those applied by FAO, are climatic agroecological zones, they are based on selection of an instance in a time series of average conditions. However, although we speak in terms of "climate change" the varying impacts of this are a direct function of seasonal or meteorological variance around the moving climatic averages. Depending upon the region and local conditions there are seasonal cycles in levels of rainfall and ambient temperature that seem to alternate over a 4-5 years cycle on average (see below).
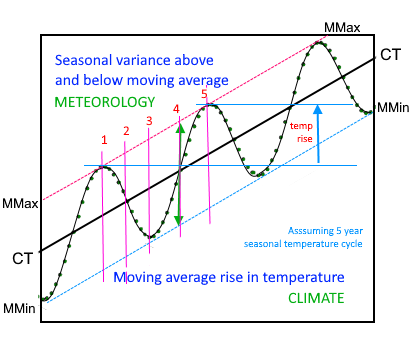
So, around the moving average of temperature and rainfall CT-CT there are seasons when variance is negative (below average) MMin-MMin and others when it is positive (above average) MMax-MMax so both temperature and rainfall can vary over a large range, in either direction and independently, by a factor of at least 15% around the moving average. So, a peak average temperature during the flowering period of coffee, based on a climatic agroecological zone, might be 30
oC but in a warmer seasonal peak, the 15% gain would represent a rise to 34.5
oC.
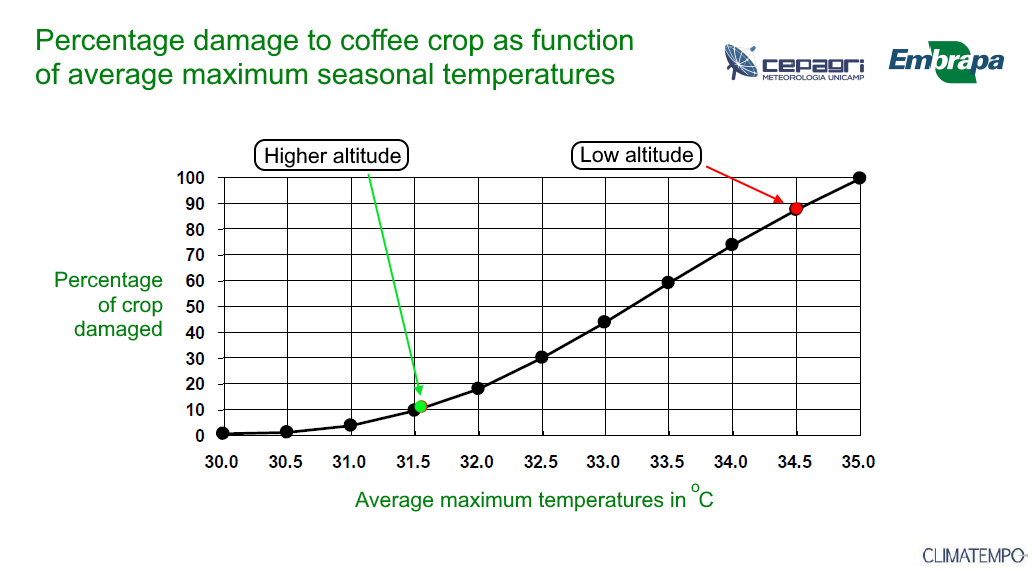
The association of coffee crop damage with temperature
from: Pinto, H. S., "AgroTalk - The Brazilian agriculture zone", CEPAGRI, EMBRAPA.
At 30
oC there is no damage to coffee flowers (Arabica spp.), so the fruit setting takes place and coffee berries are produced achieving a normal yield. On the other hand, at 34.5
oC 90% of the coffee flowers are killed resulting in no fruit setting or berry formation and about 10% of normal production (see above).
This is an example of location becoming unsuitable for coffee production as average temperatures rise but the warning comes in initial warmer seasonal cycles when a crop fails. This is followed by subsequent seasonal peaks in temperature, separated by the characteristic cycle, when the percentage of crop impacted increases. In this case, locational-state analysis points to temperature as being the problem although the rising temperatures are likely to also increase evapotranspiration in that season, and therefore water deficit which, in rain fed coffee, is likely to result in an overall decline in yields even if not all flowers are affected. The locational-state solution is to move coffee production to a zone with lower temperatures which in practical terms means moving from the current altitude to a higher altitude where average temperatures are lower. Moving to an altitude some 400 metres higher than the current production would lower average temperatures by 2.5
oC or an average of 27.5
oC. Applying the same seasonal variance calculation to this the maximum expected variance in warmer seasonal cycles would be 31.6
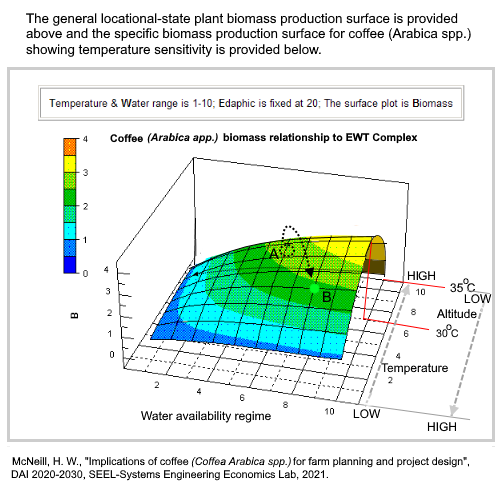
oC which would see a damage to the crop reduced to just 12%. The lower evapotranspiration, depending upon the rainfall and soil texture, could result in higher compensatory yields than outweigh this level of loss resulting from flower damage. The geographic movement described above can be represented on a general biomass locational-state production surface, below, as the movement from point A in a regime of higher temperatures to point B a regime of lower temperatures and improved water deficit (water availability) at a higher altitude.
The particular production surface for coffee in the hostile environment is however, not as shown on that projection but, in reality, it takes the form of the production surface below in which reflected the reduction in biomass achievable as a result of the higher temperature at flowering time.
Locational-state genotypic sequencing
In most parts of the world there are already genotypes adapted to higher temperature and lower water conditions and many of these occur as "landraces" or commonly produced crops that perform well under "average conditions" of ambient temperatures and water availability over the year.
As a basic locational-state principle, in a region with significant differences in elevation, the landraces at lower altitudes will tend to be more tolerant of higher temperatures than those growing at higher altitudes. Therefore, the safeguard against losses in production arising from rising temperatures and falling water availability, is to introduce landraces from lower altitudes as temperatures rise or to move production with a current landrace to higher ground. Clearly it is easier to introduce lower altitude landraces. Therefore, over time, rather than follow standard crop rotations, projects need to apply a strategy of locational-state genotypic sequencing (LSGS) in order to raise the likelihood of securing relatively stable yields "on average" in spite of long-term temperature rises.
In diagrammatic format analysis, the diagram below shows an early explanation of this issue.
LSGS-LOCATIONAL-STATE GENOTYPIC SEQUENCING
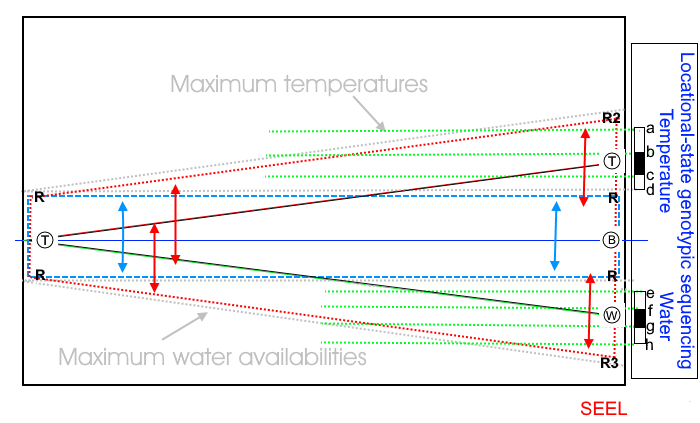
McNeill, H.W., "Temperature and water stress profiles associated with seasonal variance under rising average temperatures",
Agricultural Research, Development & Dissemination, SEEL-Systems Engineering Economics Lab, 2021, ISBN:978-0-907833-51-2.
The diagram shows an expected variance map when there is no rise in average temperatures demarcated by the blue box RRRR. The line of average temperature or rainfall is marked as TB and the max and min variance is indicated by the blue double-ended arrows.
With rises in average climatic temperatures the short term variances for temperature will rise to higher temperatures as indicated by line RR2 and the maximum water availabilities (water surplus or deficits) will decline as indicated by line RR3.
Associated with each condition strata demarcate the boundaries between genotypes that are adapted to each range of conditions a-b, b-c, and c-d for temperatures and e-f, f-g and g-h for water availability. This map is equivalent to a terrain model segment where each stratum represents a specific altitude then by transferring lower altitude genotypes to higher altitude sites can adapt production systems to the changing conditions.
Although this diagram shows water deficit rising over the long term, within seasonal variances the combination of temperature and water availability can vary. Soil conditions and especially texture, on any particular site, are an important co-determinant of yields because of its impact on water holding capacity.